Farm Finances Improve

Before 2020, agricultural banks had seen several years of rising financial strain. Farmers and ranchers had faced a half-decade of lower commodity prices, and the assets they had built up during the commodity supercycle had diminished. The USDA’s Economic Research Service (ERS) forecast that sector debt to asset ratios would be at their highest point since 2002. In April 2020, extreme lows in commodity prices led some to believe that the agricultural economy could receive a one-two punch that would lead to spikes in strain that would exceed the financial crisis or extreme drought years of the early 2000s.
Instead, financial strain saw a sharp reversal in Q2 2020 that has only continued to wane, driven at first by robust government support and then later by a surge in many commodity prices. These forces have left many producers in their strongest position in years.
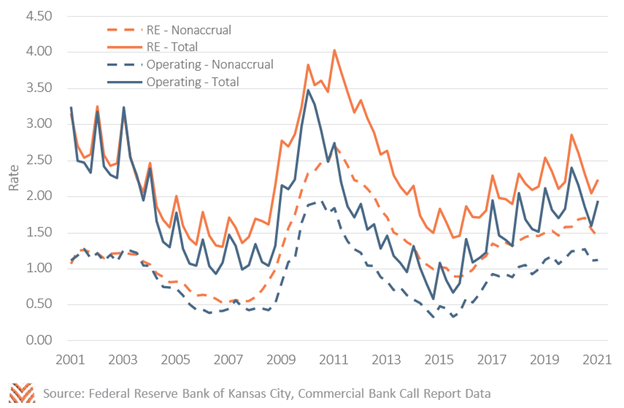
At a national level, strain at commercial banks and savings associations plummeted since the first quarter of 2020. The figure below shows nonaccrual and delinquency rates for agricultural loans by quarter. Even as commodity prices bottomed out in Q2 2020, delinquency rates improved by almost a half percent for both real estate and operating lines. By then, direct payments from government programs like CFAP and PPP had already begun hitting producers’ bank accounts. These payments had a second benefit for crop producers. Grain stocks reports suggest that producers were more likely to hold onto old crop through summer 2020 than prior years. Government support may have allowed producers to avoid having to sell storable commodities during this extreme low- price period. By Q1 2021, agricultural delinquencies were at their lowest point since 2017. Initial data from Q2 2021 suggest that these trends continued through the second quarter.
It’s important to keep in mind that this rosy national picture did not apply evenly to all locations or all commodities. While grain producers with storage capabilities could wait out low price points, this was less possible for animal product and specialty producers. The second quarter of 2020 was filled with stories about upturned vegetable fields, dumped milk, and cattle languishing on feed lots. Cattle specifically also saw tepid markets with high supply that has continued through today. The figure below breaks out the national delinquency data by bank and aggregates it to the USDA ERS resource regions—these regions group areas by their major production type. Areas that are darker blue saw improving delinquency rates between Q2 2020 and Q2 2021, while orange areas saw their local conditions deteriorate.
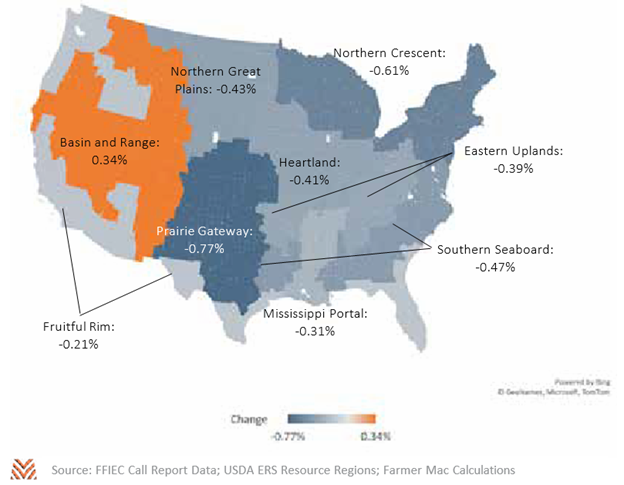
The picture this breakout paints largely aligns with what we know about producer incomes from last year. The sole region with deteriorating conditions, the Basin and Range, is a major cattle region that is also in a region with extreme drought. Despite considerable government payments, persistent poor market conditions may have impacted banks who were largely reliant on cattle, like many in the Basin and Range. Meanwhile, areas like the Fruitful Rim saw underwhelming delinquency improvements. This sort of region is reliant on specialty crops like tree nuts, cotton, or fruit and vegetables; national government payment data suggested these commodities may have received less direct payments from programs like CFAP. Additionally, many of these commodities, like almonds, have seen persistent poor prices in part due to continued impacts from the global downturn.
Conversely, areas like the Northern Crescent saw considerable improvements in local financial conditions. This region consists of dairy and cash grain operations and had seen some higher strain due to low milk prices before 2020. After an initial collapse of the dairy markets in April 2020, dairy producers saw both direct government payments and market supports through the USDA Food Box program. And while the Heartland saw less improvement in local financial conditions, consider that this region already had some of the lowest delinquency rates in the country in 2019. Regions that are corn-, bean-, and hog-dependent have seen delinquency rates fall to recent historic lows.
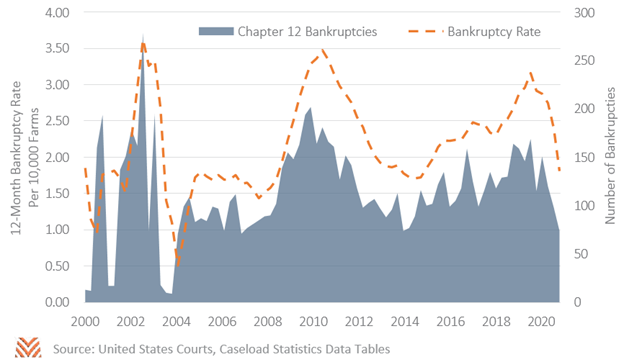
Another way of viewing financial strain is through farm bankruptcies. Since the mid-1980s, most farmers who filed for bankruptcies have used Chapter 12, a provision specific to farmers and fishers which enables producers to retain assets far more easily than they would under other bankruptcy chapters. The figure below shows the number of Chapter 12 filings by quarter and the rate per 10,000 farmers. Like with delinquencies, we see a trend of improving conditions following a peak in bankruptcies in Q1 2020. In Q2 2021, the U.S. courts witnessed the fewest Chapter 12 filings since 2014, signaling that several years of strong government support and higher incomes have contributed to lower financial strain.
In short, most producers are seeing improving financial conditions for the first time in almost a decade. The robust government support of 2020 and the commodity price boom of 2021 appear to have made the difference. Incomes are up, working capital is up, land values are up, and delinquencies and bankruptcies are down. Even if the commodity price increases aren’t sustained over the long term, these higher-income years are helping producers recapitalize after years of lower incomes. The next time the agricultural economy takes a hit, producers should be in a better position to withstand the pressure.