The Farm Economy in Transition

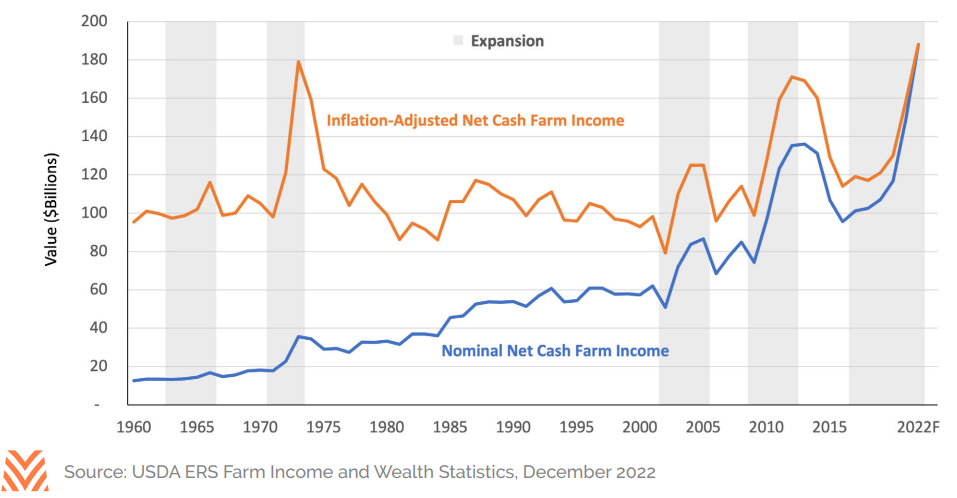
After two years of higher commodity prices and elevated returns, U.S. farmers and ranchers are experiencing another expansionary ag cycle. This is the second expansion (defined as four or more years of consecutive increases in net cash farm income) in 10 years and the third in 20 years. Following a surge in commodity prices in 2021, shocks to global grain supplies—combined with a strong rebound in global demand for dairy and protein—pushed prices even higher in 2022. Revenues are only half of the equation, and many operations did simultaneously face significantly higher farm expenses, including fertilizer, fuel, and feed. However, the increase in revenues ultimately outpaced that of expenses, resulting in an estimated record-setting level of net cash farm income (NCFI) at $187.9 billion.
Meanwhile, a low-interest environment in 2020 and 2021 pushed up farmland asset values into 2022. The value of farm real estate, the largest portion of the farm balance sheet, is expected to have increased by more than 10% in 2022.
Thus, for both the income statement and balance sheet, conditions in the ag economy look good in the near term. That said, while the fundamentals supporting the current expansion are strong, historical ag cycles have taught us to watch out for a wicked combination of rapidly rising supplies, falling commodity prices, and rising expenses.
Farm Income and Profits
If realized, the increase in net cash farm income in 2022 would represent the sixth consecutive year of increases, a run not experienced since World War II (see the figure below). The incredible demand for food products and a global dip in supply for many consumer-oriented and bulk ag products helped boost prices in 2021 and helped to keep them high in 2022. The increase in 2022 was driven by higher cash receipts from corn ($19.6 billion increase, or 28%), broilers ($17.4 billion increase, or 55%), dairy ($15.9 billion increase, or 38%), soybeans ($14.5 billion increase, or 30%), and cattle ($13.9 billion increase, or 19%). Only a handful of commodity categories are estimated to have experienced a decline in cash receipts in 2022, mostly vegetables and field crops. The beginning of this expansion was fueled by government support programs: the Market Facilitation Program drove more than $19 billion in total increases to NCFI between 2018 and 2019, and the Coronavirus Food Assistance Program added another estimated $32 billion between 2020 and 2022. In 2020, government payments represented 39% of total NCFI; for 2022, the USDA estimates the percentage will be less than 9% and will be roughly on par with the last expansionary cycle from 2010 to 2014. This transition of economic activity from the government to the market is typical during each cycle expansion in modern agricultural economics.
Revenues aren’t the only thing on the rise: the USDA estimates that cash farm expenses will touch a new nominal record in 2022, at over $412 billion. Even adjusting for inflation, this year’s cash expenses represent the second-highest level in history, behind only 2014. The largest single category increase is expected to be in fertilizer expense on the back of a global energy price spike, complicated by Russia’s invasion of and ongoing war with Ukraine. This was a large increase indeed; the USDA estimates U.S. farmers spent over $43 billion on fertilizer and nutrients in 2022, a whopping 47% increase over 2021. Farmers and ranchers also spent more this year on feed (up 17%), interest expense (up 41%), and fuel (up 47%). These increases have contributed to an estimated rise in overall cash expenses of 19% in 2022, the biggest single-year jump since 2007. While many of these current drivers of farm expenses are energy-related and could pull back in the coming quarters and years, some categories lag expansions and may have yet to be seen. Seed, rent, and even interest expenses could remain sticky even if other expense categories calm down.
Farm Balance Sheets
The composition of farm balance sheets lends itself well to a low interest rate and real asset investment environment like that experienced in 2020, 2021, and early 2022. Farm real estate represents a staggering 83% of the sector balance sheet. In part, that’s because real assets with cash flow-generating capacity, like farmland, find interested buyers during volatile economic conditions or when inflation is heightened. Furthermore, when farm incomes are rising, farmers, ranchers, and other farmland investors increase interest in the asset class. During the five expansionary cycles since 1960, farm real estate has increased at an average real rate of 4.9% per year compared to an average real rate of only 0.1% per year during all other years. Other common measures of farm balance sheet health, including working capital, current ratio, and overall leverage ratios, all signal a financially healthy sector in 2022.
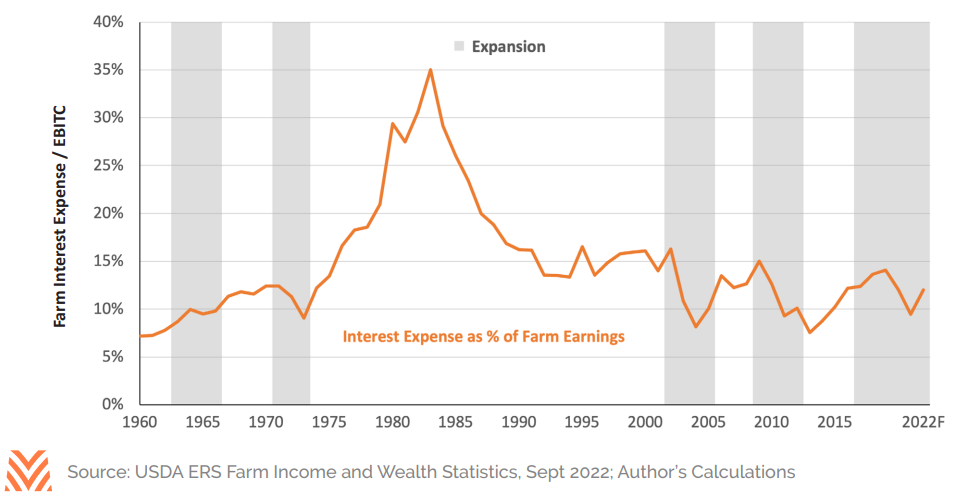
While farm debt and interest rates continue to climb in 2022, data indicate that current debt levels are supportable by the sector. First, the USDA estimates that nearly 70% of farm debt in 2022 will be secured by real estate, up from the historical average of just over 50%. Mortgages can have significantly longer terms and fixed-interest-rate periods compared to non-real estate loans, giving many farmers and ranchers significant risk reductions in the event of a rapid increase in interest rates. Second, even with a 39% increase in interest expense in 2022, the ratio of interest expense to farm earnings remains well below historical averages, as shown in the figure below. In 1983, farmers and ranchers spent nearly thirty-five cents of every dollar earned farming on interest. Today, that figure is approximately twelve cents, below the 60-year average of fifteen cents. Both farm earnings and assets appear healthy enough to absorb a reasonably volatile interest rate environment for the near future.
Outlook for 2023/24
Economic expansions can languish for lots of reasons, but in agriculture, contractions are almost always associated with overproduction and ample global supply. In both the 1970s, 2000s, and 2010s, severe drought caused grain shortages. The commodity price spikes drew additional acreage into production, and in the years that followed, production and supplies outpaced demand. The current crop outlook certainly rhymes with the expansions of the past, with multiple drought-stricken regions in the U.S., South America, Europe, and Oceania. However, the rebound in production may be one or two seasons away and will depend on the outcome of the war in Ukraine as well as on global economic health. U.S. farm revenues could hold or even advance in 2023 in the absence of exceptional weather in South America and Europe in the spring. Some expenses could retreat in the coming growing season, but any relief could also be absorbed by higher expenses in other categories. Lower energy prices may give way to higher seed, labor, water, and interest expenses. Farmers, ranchers, and lenders should prepare for budget management in 2023 and 2024 as the world steadies agricultural supply and demand. If history is a guide, NCFI should contract slightly in 2023 and potentially more in 2024. But the run could instead continue if the world sees another short wheat, corn, and soybean crop in 2023. Fortunately, farmers and ranchers are in a great position to manage through the next cycle, whenever it happens.