Farm Income Update
On September 2, the USDA’s Economic Research Ser- vice (ERS) issued its latest Farm Income and Wealth Statistics release, which included its second forecast for 2021 and its first set of estimates for 2020. There were two major themes of this release: First, producers should generally expect strong incomes in 2021 despite falling government payments; and second, the damage to the underlying agricultural economy in 2020 is estimated to be more significant than was suggested by the USDA’s last release in February. Both stories are not universal, as some producers saw good results in 2020, while others have not benefited from the booming incomes of 2021.
Strong 2021 Incomes
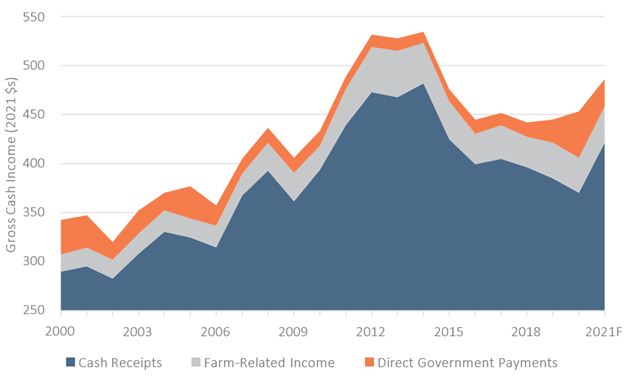
In general, farm incomes are projected to be very strong for 2021. Total net cash income is forecast at $134.7 billion for 2021, up 17% from 2020, though still well below supercycle peaks. While commodity prices have improved through 2021, strong incomes are also a function of higher government payments. The figure below shows sector gross cash income broken out by major type. The blue area represents all income from the sale of commodities, which is a good proxy for the overall health of the farm economy. While total farm incomes in 2021 are projected to be at their fourth highest point in real terms since 2000, cash receipt income is forecast to be similar to 2015 income—good, but not great.
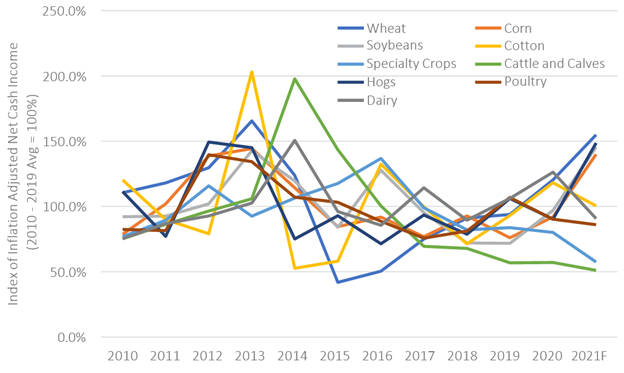
These conditions will likely not be realized sector-wide in 2021. The figure below shows average net cash farm income by farm business specialization. The USDA ERS forecasts that the average wheat, soybean, corn, and hog operation will see net cash incomes almost 50% higher than their average since 2010. In fact, the USDA currently forecasts that these producers will see incomes in 2021 that rival those seen during the supercycle era. Unlike in the supercycle, however, not every commodity is seeing a boom. On the other end of the spectrum, cattle producers and specialty producers (like fruit and tree nut farmers) are forecast to see their lowest incomes on average since 2010. Cattle futures and recent fruit and tree nut data suggest the potential for a turnaround late in 2021, but the USDA’s forecasts are reflecting their struggles to date.
Financial Strain
One positive bit of information was on overall sector financial strain, which appears to be lessening. Since 2012, the farm sector’s debt to asset ratio has increased every year. Measures of liquidity and profitability have shown similar trends since the supercycle era. This farm income release indicates a break in that pattern, forecasting that these measures will all improve. Sector debt to asset ratios are forecast to fall to 13.6% in 2021, down from 14.0% percent in 2020, though still well above the 2010–2019 average of 12.5%. Working capital is forecast to be at its highest point since 2014, and many measures of profitability are also near supercycle levels.
The sharp income shock has led to other unique impacts on strain measured by the USDA. The USDA’s estimate for farm bankruptcies finds that bankruptcies should be at their lowest point in over a decade. It also finds that producers’ ability to service debt will be at its highest point since the end of the supercycle, and overall farm debt is forecast to decline for the first time since 2012. This is led by a predicted 6% decline in total operating loan debt in real terms, though real estate debt is forecast to show a smaller decline. Interestingly, the USDA projects that total real estate asset values will decline in 2021, despite the strong land values reported in the USDA’s annual land value report.
2020 Updates
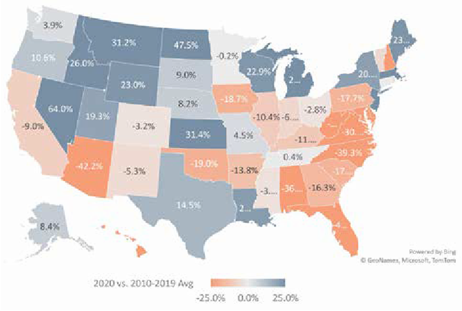
The September update is also when the USDA releases its first state-level estimates for prior year farm incomes. For this report, they issued a sharp downward revision in their expectations for 2020 income, driven largely by lower estimates for cash receipt income. However, regions saw very divergent outcomes from last year that depended on their local commodity mix. The figure below shows incomes for 2020 relative to a state’s 10-year average. In general, the Southeast saw far lower incomes than their recent averages. In the Northern Plains, states benefitted from an early surge in wheat prices. Major dairy producing states, like Michigan and Wisconsin, also saw very strong incomes in 2020, due to strong dairy prices through much of the year.
While these stories were largely known before the September release, the story of the eastern Corn Belt was more of a surprise. Many eastern Corn Belt states were among the largest recipients of Coronavirus Food Assistance Program funds. While this program was designed to be countercyclical, mid-year price surges in hogs, corn, and soybeans appeared to position these producers in this region better than those in almost any other region in the country. However, these new estimates suggest that a large quantity of both old and new crop corn and soybeans were sold during the low-price period between April and September 2020, leading to far lower overall receipts than season average prices would indicate.
Despite these small areas of concern, the overall thrust of this release is good. Many producers will receive their strongest farm incomes since 2014, with considerable government spending adding to a strong year for cash receipts. These incomes will reverse a near decade-long trend of increasing financial strain that has been observed in these forecasts. However, producers and lenders should be prepared to see lower incomes in 2022. The ERS paints a picture of a 2021 farm economy that resembles 2015, but with additional government support. Producers and lenders should prepare for a single year of very high incomes with a good, but not great, year to follow in 2022.