Agricultural Commercial Banks End 2021 on a Strong Footing

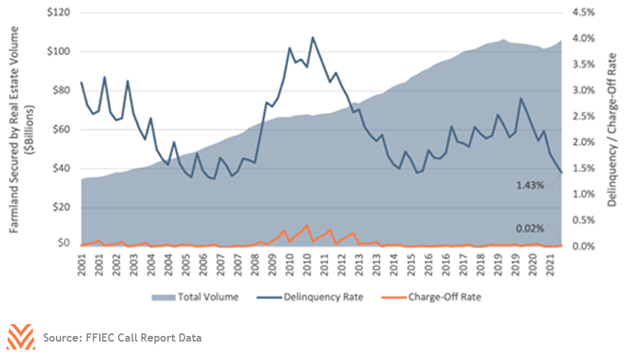
With the release of the Q4 commercial bank call reports in February, we can begin to assess how strong the agricultural economy looked at the end of 2021 from the perspectives of agricultural lenders. The figure below shows the total volume and delinquency rates for all loans secured by farmland. Two trends are immediately apparent. The overall strain on agricultural lenders, as measured by delinquencies and charge-offs, is the lowest it has been since the tail end of the 2011– 2015 supercycle, and total volumes are nearing the peak set in Q2 2019. The market has begun to resemble that robust period when rising land values and strong farm incomes led to solid credit health across the sector.
Mergers and Acquisitions
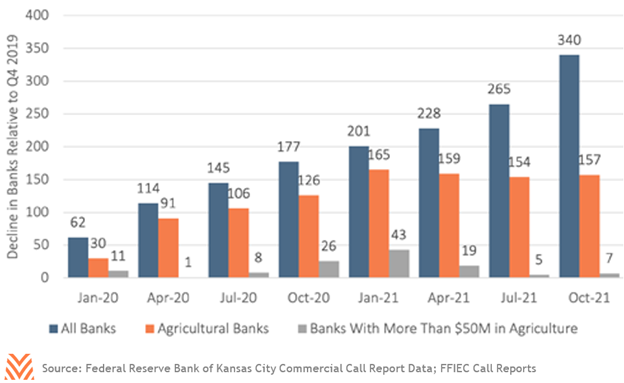
This credit health may be behind a decline in merger and acquisition activity among banks involved in agricultural lending. The figure below shows the decline in commercial banks and banks involved in agriculture relative to Q4 2019. As of Q4 2021, the FDIC reported that there were 1,121 “agricultural banks” with at least 25% of loan volume coming from farm production or farmland loans. This represents a steep decline from the 1,278 agricultural banks that were reported in Q4 2019. However, the decline in this metric occurred almost entirely in 2020, as agricultural banks saw periods of high delinquency rates and declining volumes. Through 2021, the number of banks considered “ag banks” increased, even as merger and acquisition activity continued across all commercial banks.
A second way to measure impact to the sector is through the number of entities with sizable agricultural portfolios, even if that portfolio is small relative to their total size. By this measure, the number of commercial banks with at least $50 million in agricultural loans is largely unchanged from 827 in Q4 2019; compared to 822 as of Q4 2021.
The true impact on agricultural banks may be even less than what these data suggest. The sharp rise in Q2 2020 may be obscured by reporting of Paycheck Protection Program loans. These volumes may have caused some institutions to fall below the threshold of what defines an “agricultural bank,” despite not reducing their overall agricultural lending activity. According to the FDIC’s Business Combination data on merger and acquisition activity, 83 agricultural banks were acquired between January 2020 and December 2021—less than half the number shown above. This means that roughly half of the reduction in the number of agricultural banks between the end of 2019 and 2021 was driven by banks that fell below the 25% threshold, and not due to failures or acquisitions.
This still indicates that around 6% of all agricultural banks were acquired over the last two years. The FDIC observed no failures over that time. In almost all cases, banks that acquired agricultural banks had significant agricultural portfolios themselves. 80 of the 83 acquisitions were by institutions with at least 5% of total loans and leases in agriculture. Many of the acquisitions also occurred among smaller institutions. 60 of the acquisitions were to institutions with less than $1 billion in assets under management. The most common type of entity to purchase an agricultural bank over this time was a small bank with at least 25% of their loans in agriculture. For all mergers and acquisitions over this period, more than 80% of acquiring institutions were headquartered in the same state as the entity being acquired, with almost a third headquartered in the same county.
Volume Changes
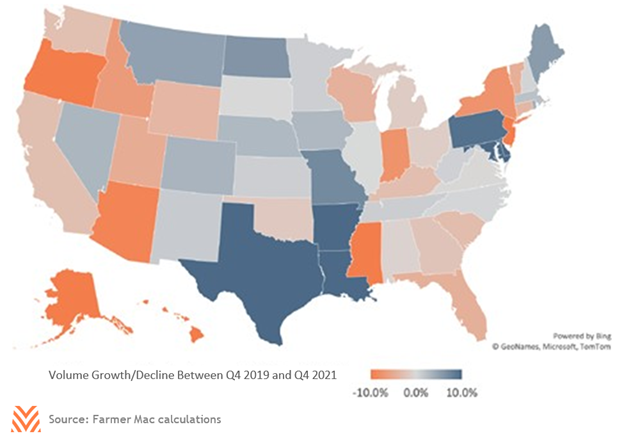
While total real estate volumes grew 1.5% between Q4 2019 and Q4 2021, there is evidence that there was some regional variation in how loan volumes grew or contracted. The figure below shows a map of estimated loan volume growth across states, which we obtained by distributing commercial banks’ agricultural volumes across the counties it operates in. This is an imperfect measure, but it can help show regional patterns and trends that are not immediately apparent. As this is for commercial banking only, it does not factor in loan volumes through the Farm Credit System, nontraditional lenders, or other sources.
First, the growth of loan volumes in these periods is loosely correlated with growth in land value growth over the last year. Much of the Southeast has experienced loan volume declines, which was also the region with the slowest land value growth estimated by NASS. Volume growth was positive in the Midwest and northern Plains states, where some of the fastest land value growth was observed over the prior two-year period. The West Coast bucks this trend, with falling estimates for volumes despite some of the fastest land value growth. One potential explanation is merger and acquisition activity, as these regions saw some of the sharpest reductions in the number of unique commercial banks with agricultural portfolios. The Southeast and West are also areas where competition from entities other than commercial banks is rising, which may be leading to variations in volumes.
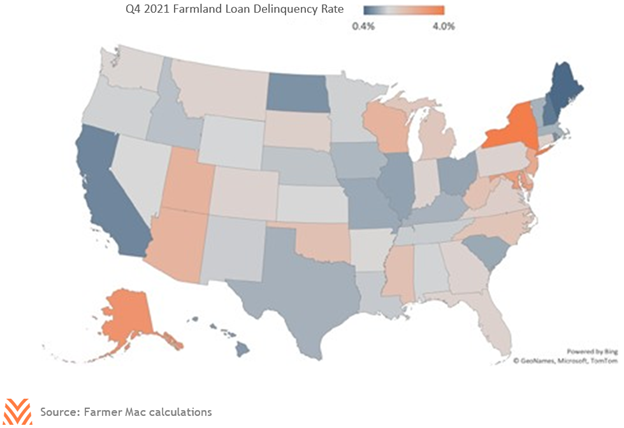
If a similar approach is used to distribute real estate delinquencies, as shown in the figure below, patterns emerge that may be explained largely by commodity prices or profitability. States in the Midwest that are highly reliant on corn and soybean sales saw lower than average delinquency rates. Conversely, states with high reliance on dairy incomes saw higher than average delinquency rates, which may be driven by tight profitability margins in the sector. Not all areas follow this trend; the California commodity mix was under some of the most duress in 2021, but local loan performance was likely better than most of the country.
While there are minor regional variations, the commercial banks that support agriculture are in a strong position. Volume growth is a welcome sign after the first true period of contraction in decades. Delinquency rates are near multi- decade lows. Merger and acquisition activity of agricultural commercial banks continues, but often to commercial banks who are local are also interested in agriculture. The one potential risk is that many areas haven’t seen loan volume growth despite the period of low-interest rates and higher land value growth. While it is unclear whether this is driven by competition or loan demand, it is something worth watching as we enter a rising rate environment.