Inflation and Interest Rates in Focus

No matter the context, inflation has been one of the biggest economic stories of the year. What started with an increase in the price of used cars and appliances in 2021 continued with a spike in the price of groceries and gasoline in 2022. The story is now about the rising price of everything in 2022, affecting consumers of all stripes and delivering the fastest increase in the price of U.S. goods and services since the 1980s.
The causes of increasing prices can be numerous and nuanced, but the effects can be a blunt force: the consumer can afford less and is forced to adapt behavior. And because an estimated 70% of the U.S. economy is powered by consumer spending, changes to consumer behavior are a huge deal.
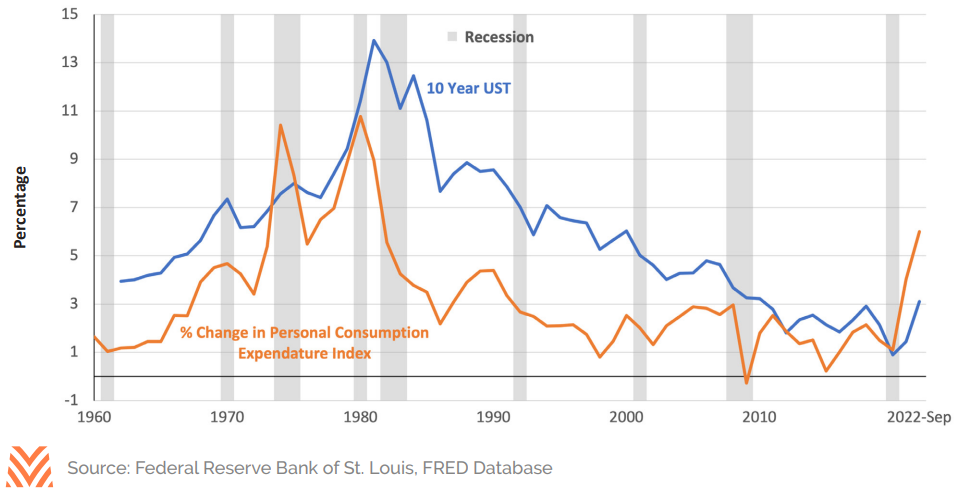
One cure for a rapidly rising price environment is to raise the price of money—or, said differently, to increase interest rates. Central banks have been using that prescription to fight inflation for decades, and the last time the U.S. experienced inflation at this level (in the 1970s), the Federal Reserve (the Fed) raised interest rates and successfully tamped down inflation. While today’s economic environment is different from that in the 1970s in many ways, the relationship between inflation and interest rates continues. The figure below highlights this historical relationship as well as the recent increase in both inflation and interest rates.
Sources and Drivers of Inflation
Price inflation typically starts with either a supply-side shock or excess demand. In a supply- side shock, the supply of goods and services is constrained, which causes retailers and wholesalers to raise their prices in response to the lack of available products to take to market. An example of supply-side inflation is when a kink in the gasoline supply chain causes prices at the pump to spike. With excess demand, on the other hand, consumers have an ample amount of funds and are willing to bid up prices in order to secure the goods and services they demand. An example of excess demand was seen when housing prices boomed in the mid-2000s, where home buyers had a seemingly endless supply of available credit and too many buyers were chasing too few houses on the market.
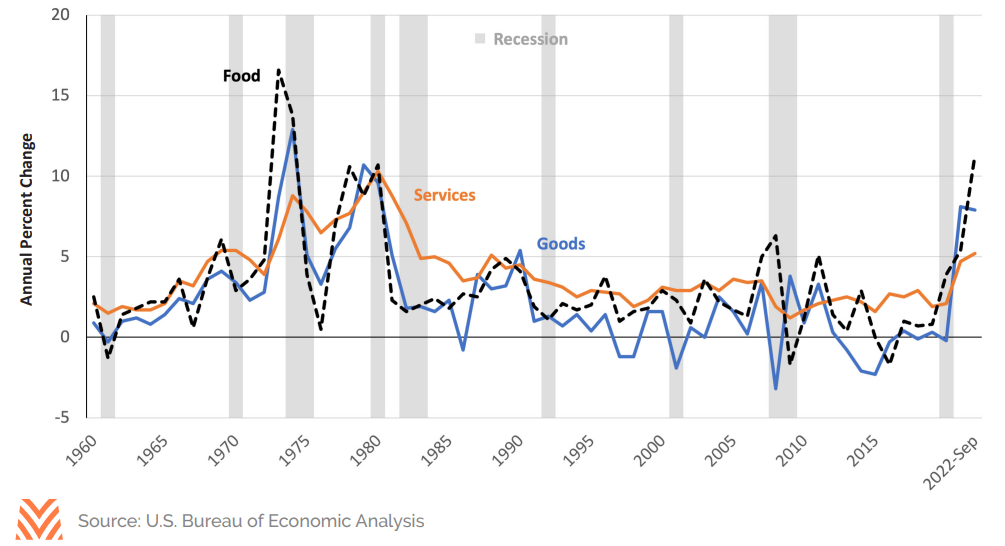
In the shadow of the COVID-19 pandemic, the U.S. faced both sets of inflationary conditions. First, supply chain disruptions caused a decrease in the availability of goods for consumption. Everything from food to futons was seemingly out of stock or difficult to find. Global shipping costs skyrocketed as lockdowns closed ports, and many manufacturing plants temporarily closed to attempt the prevention of viral spread. Second, government support programs blanketed U.S. consumers with cash in 2020 and 2021. These payments helped offset wages for millions during global lockdowns, buttressing mortgage and credit markets from potential calamity; however, they also provided the fuel for a surge in consumption. Finally, Russia’s advance on Ukraine and the global sanctions that followed put the oil and energy markets into disarray. This final nudge exasperated both supply-side constraints and demand-side surges. The figure below displays the 12-month trailing price level increases for U.S. goods, services, and food for the last 60 years. While inflation rates slowed in the fourth quarter of 2022, level increases are at their highest since the 1970s.
The Fed’s Response
Seeing the pressure building on consumer prices, the U.S. central bank took action in early 2022. The Federal Reserve Act of 1913 clearly sets the objectives of the Federal Reserve System to conduct monetary policy “…so as to promote effectively the goals of maximum employment, stable prices, and moderate long-term interest rates.” Two arrows in the Fed’s quiver of tools are to raise and lower the Effective Federal Funds Rate (Fed Funds) and to buy and sell market assets onto its balance sheet. The Fed Funds rate is the reference rate for which banks and depository institutions charge each other to borrow and lend short-term money to meet regulatory capital requirements. A higher rate encourages banks to hold more capital and reduce borrowing, thereby constricting the economy. Buying and selling assets is a way to influence more long-term and credit market interest rates by absorbing any excess supply of long-term bonds like a sponge. Conversely, the Fed can raise long-term market rates by selling assets or simply not buying assets and letting that water in the sponge re-enter the market. In March 2022, the Federal Reserve shot both arrows, raising the Fed Funds rate target by 0.25% and ceasing new asset purchases. Since then, the Fed has raised the target rate five times and shrunk the massive balance sheet by 4% in the fastest U.S. monetary policy tightening cycle since 1981.
Real Interest Rates and Real Estate Prices
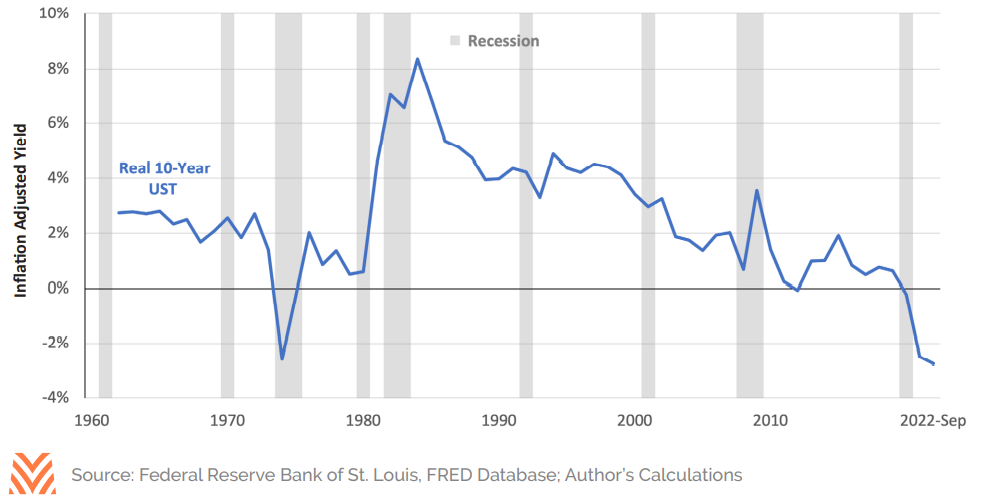
Where inflation, interest rates, asset prices, and Fed policy collide is in the concept of real interest rates. A real interest rate is a security’s market interest rate adjusted for the rate of inflation. The figure below shows the rate of return on a 10-year U.S. Treasury bond adjusted for the level of inflation as measured by the increase in the Personal Consumption Expenditure price index. When real treasury rates are high, as they were in the 1980s and 1990s, the returns to risk-free assets attract more investors, and money flows out of risky assets like stocks and real estate and into fixed-income investments like bonds. Conversely, when real interest rates are low, the real cost of borrowing incentivizes investors to borrow and invest in risky assets to achieve higher returns. In the extreme case of negative real interest rates, risk assets can see extreme price appreciation as investors borrow more to try and capture rapidly rising returns from inflationary prices. In the 1970s, negative real interest rates correlated with the fastest rise in farmland values in modern history. Similarly, negative real interest rates in 2013 and 2021 corresponded to large increases in farmland values. And despite rapid increases in rates in 2022, real interest rates remained in negative territory in the fourth quarter of 2022.
The level of real interest rates could be an interesting leading indicator to monitor. First, if food price inflation remains positive and real interest rates remain negative, there should be support for farmland values to hold or possibly advance, even in the face of higher interest rates. Second, inflation levels may indicate where the Fed could drive interest rates in the coming months. If inflation is hovering around 5% and the long-term average historical real interest rate is 2%, the Fed is likely to continue to tighten monetary policy. However, if inflation starts to come back down to 3%, the Fed is likely to slow or even pause tightening as the real rate would start to approach 1%. While it may not be a perfect crystal ball, any clarity in the haze of inflation and interest rates is a welcomed focus.